Welcome
API Examples
- Basic charts - display a simple chart of precipitation data
- Table - display precipitation data in a table
- Mapbox map with points - show rain accumulation over the previous 48 hours on a map
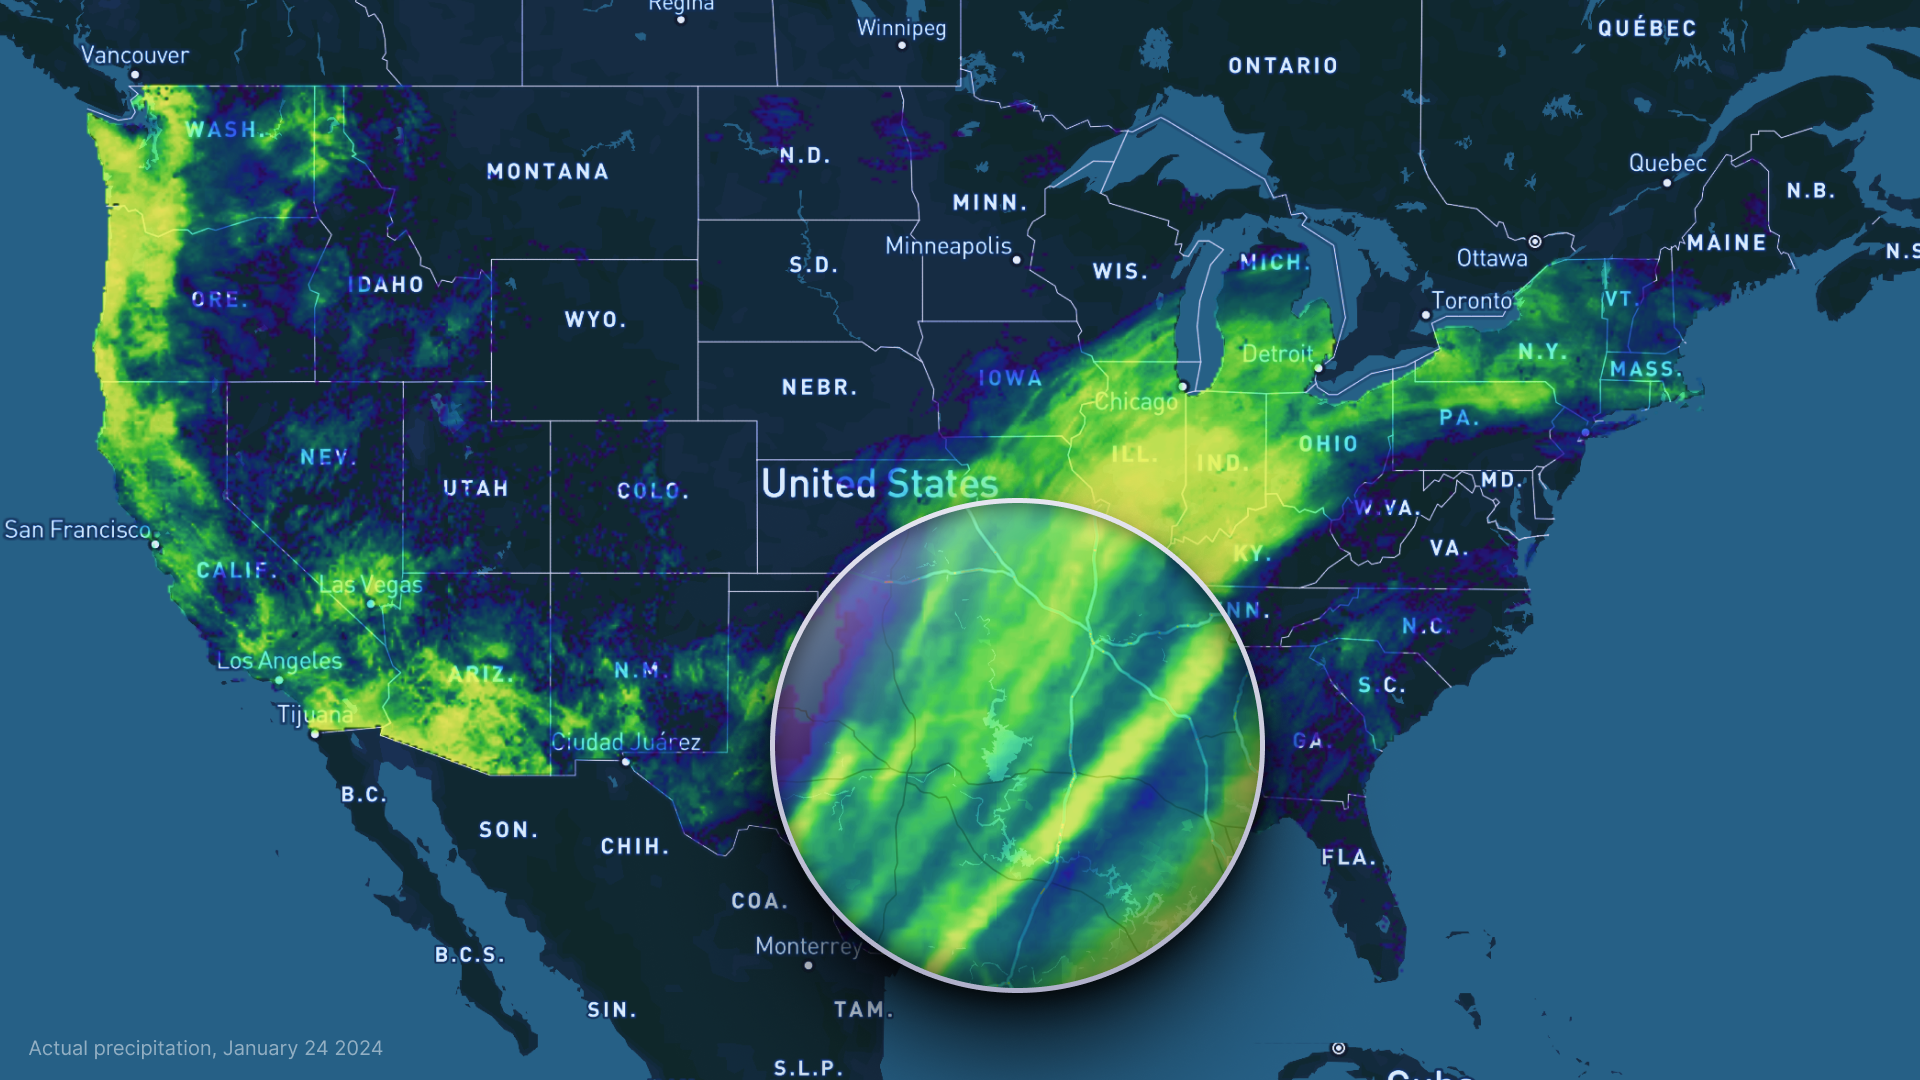
- Mapbox map with tiles - show rain accumulation over a 24 hour period
Embed UI
Looking to embed precipitation data directly into your website without having to make your own UI? Check out our examples belo to see how you can put Precip data in your own application with minimal coding.
- Simple HTML iframe embed - embed UI directly in HTML
- Embedded React component UI - interactive React component with location switching
Demo Map
Our live demo uses Precip data to show rainfall accumulation over a trailing 48-hour period.
Last modified on