Nowcast archive (Icechunk)
Every real-time run of Precip's precip-rate-v4 5-minute precipitation nowcast over CONUS, published 24 hours after initialization for independent evaluation. No API key is needed.
Data is available from 2026-09-27 13:55 UTC (the first real-time run) up to 24 hours before now.
Read it in Python
Code
Code
Reads are lazy and fetch only the 128×128-pixel chunks you touch. Older xarray releases (2025.4 and earlier) fail on current zarr with AttributeError: 'UInt16' object has no attribute 'value'; upgrade xarray to fix it.
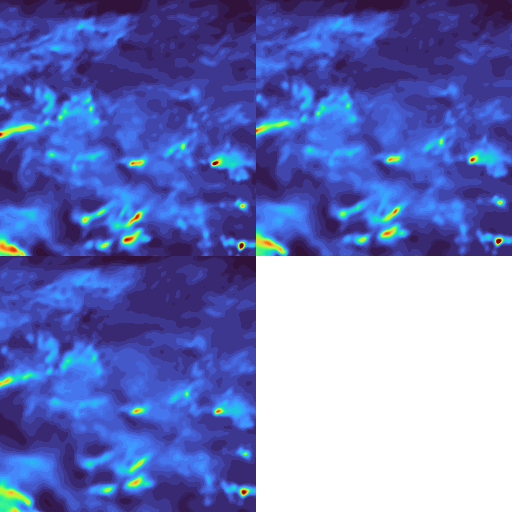
Example: 15-minute rain loop
The first 3 leads (0, 5 and 10 min) of the 2026-09-30 18:00 UTC run over a 256×256-pixel box in Nebraska and Kansas.
Code
Example: forecast at a rain gauge
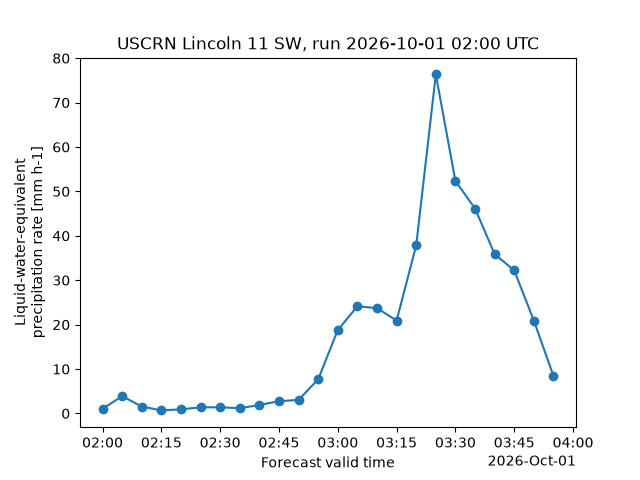
The 2026-10-01 02:00 UTC run at USCRN station Lincoln 11 SW, Nebraska, which recorded 42 mm of rain between 03:00 and 04:00 UTC.
Code
Dataset
| Field | Details |
|---|---|
| URL | https://api.precip.ai/icechunk/precip-rate-v4/5min (Icechunk repo, branch main, group mrms_native) |
| Variable | precipitation_rate: liquid-water-equivalent rate in mm/h, the probability-matched mean of a 4-member ensemble. Stored as uint16 × 0.01; xarray decodes it, and missing values become NaN. |
| Grid | Native MRMS 0.01° lat/lon (EPSG:4326), 3500 × 7000. Cell centers run 54.995°N–20.005°N and 129.995°W–60.005°W. |
| Runs | Every 5 minutes from 2026-09-27 13:55 UTC. Only runs produced in real time are included; gaps in init_time are operational outages. |
| Leads | 24 leads at 5-minute steps, 0–115 min. valid_time = init_time + lead_time. |
| Inputs | The newest radar frame is at init_time − 5 min, so lead 0 is already a forecast. |
| Delay | A run appears once its init_time is at least 24 hours old. The archive is append-only, with one Icechunk snapshot per run. |
| Format | Icechunk 2 / Zarr v3 with CF-1.11 metadata. Readable with icechunk ≥ 2.0 and any Zarr v3 client. |
Reproducibility
Pin your analysis to an exact archive state with the snapshot id you read:
Code
Terms of use
Free for non-commercial scientific research, publication, and forecast verification or benchmarking, with attribution to Precip (precip.ai). Commercial or operational use, and redistribution as a data product, require written permission from Precip.
A standalone version of this page is at api.precip.ai/icechunk.